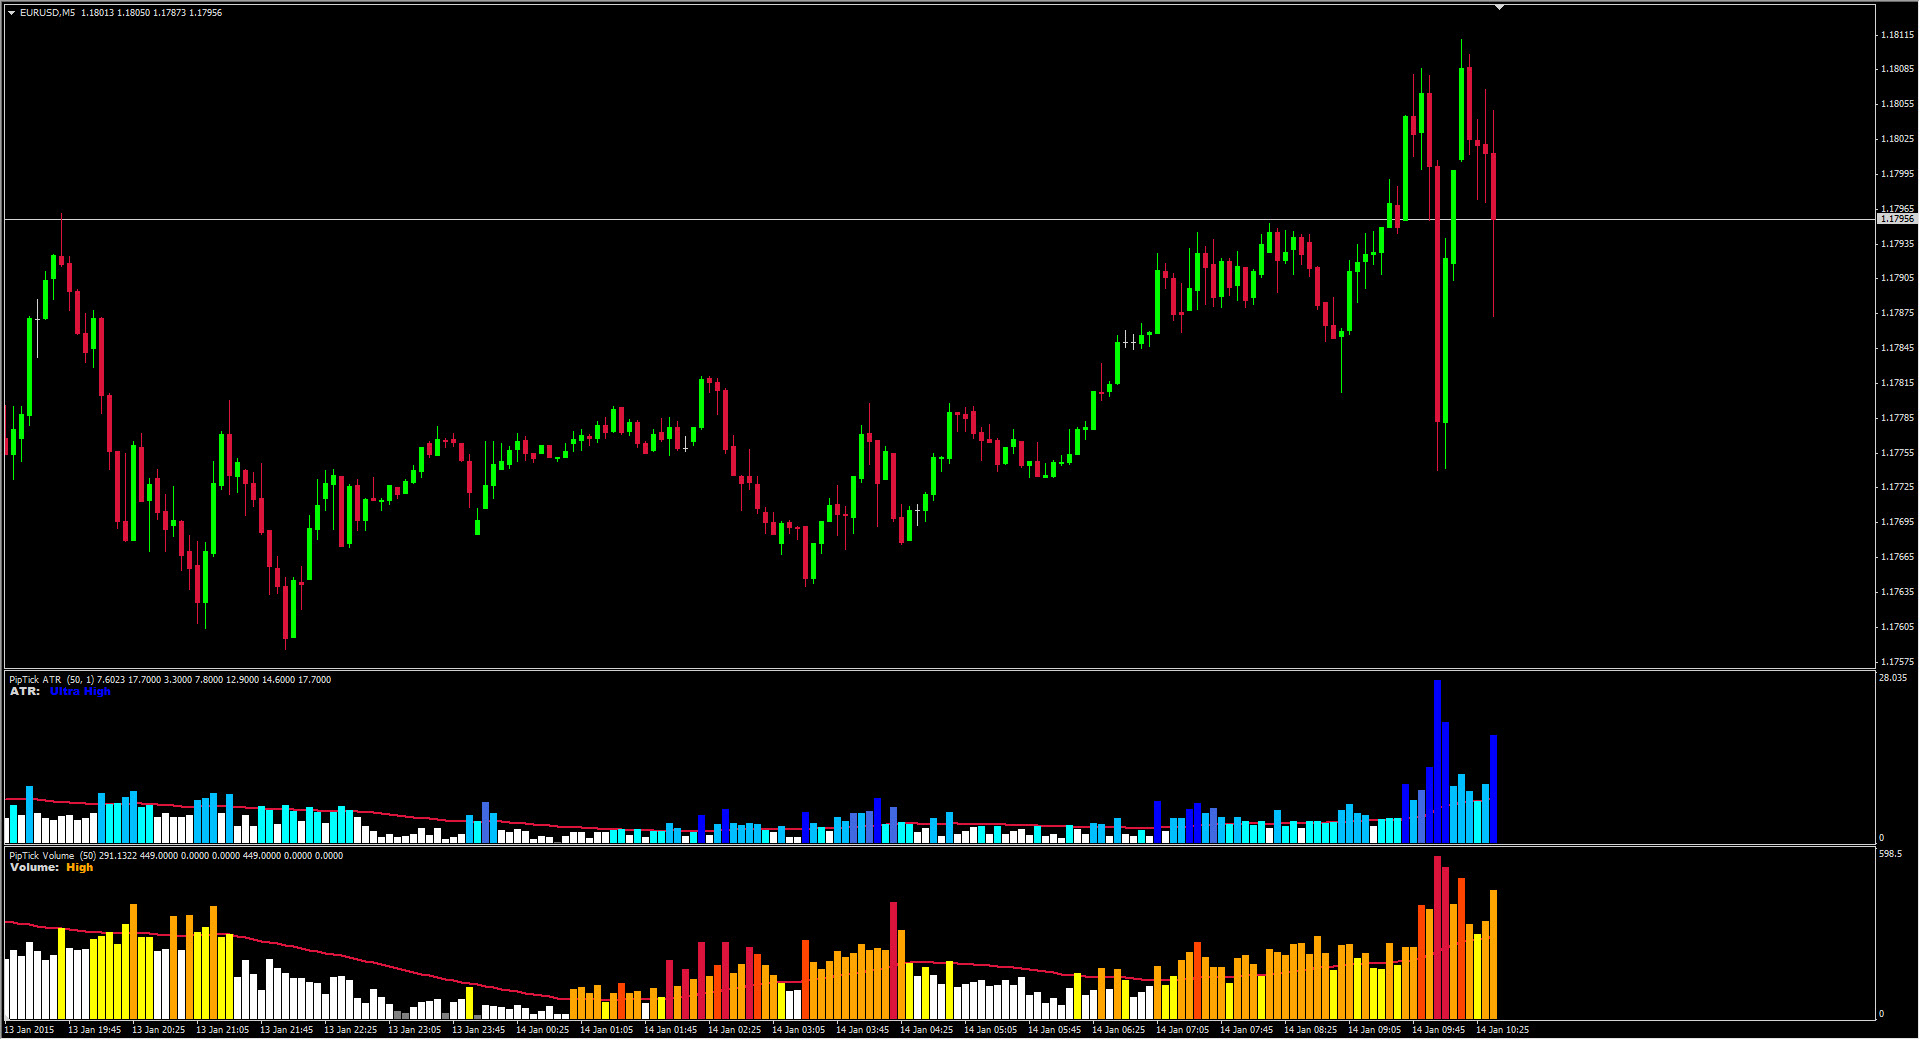
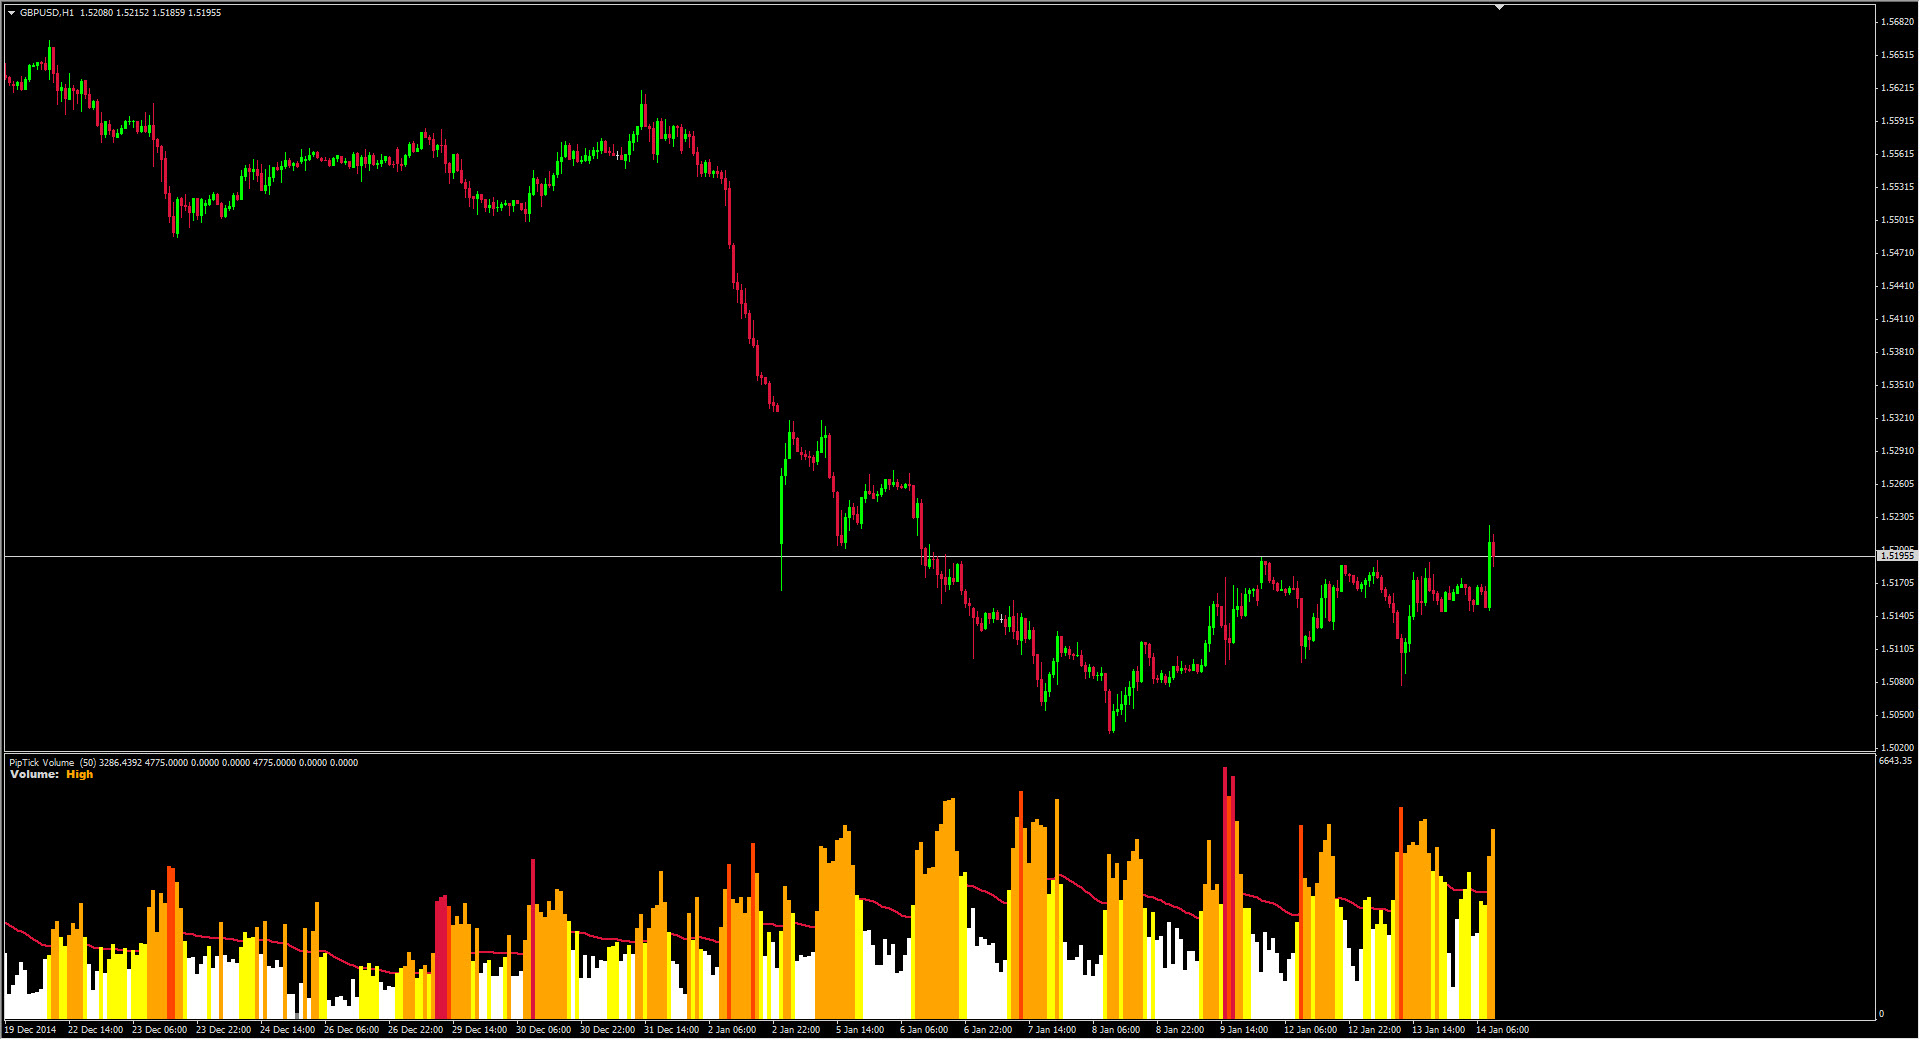
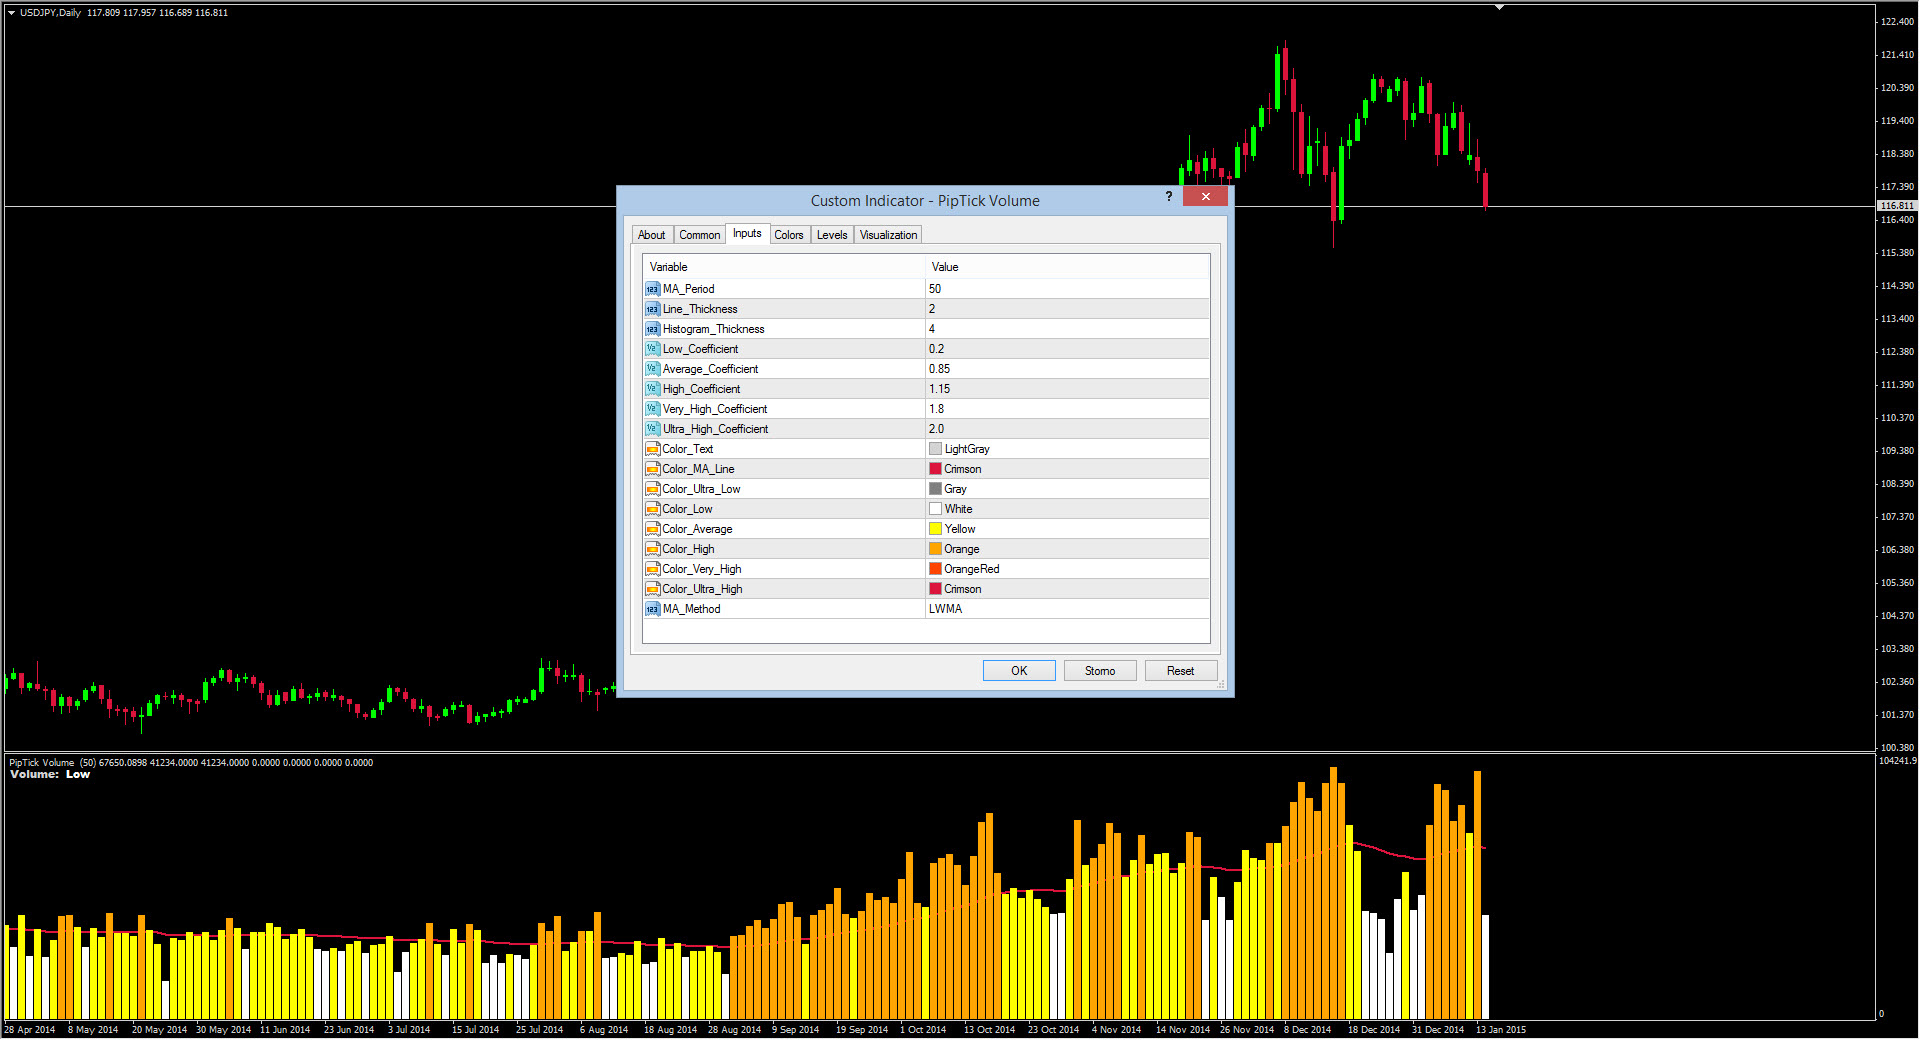
The Volume indicator is an excellent tool for measuring tick volume or real volume activity. It quickly and easily helps traders evaluate the volume’s current size. The indicator for classification of the volume size uses the moving average and its multiples.
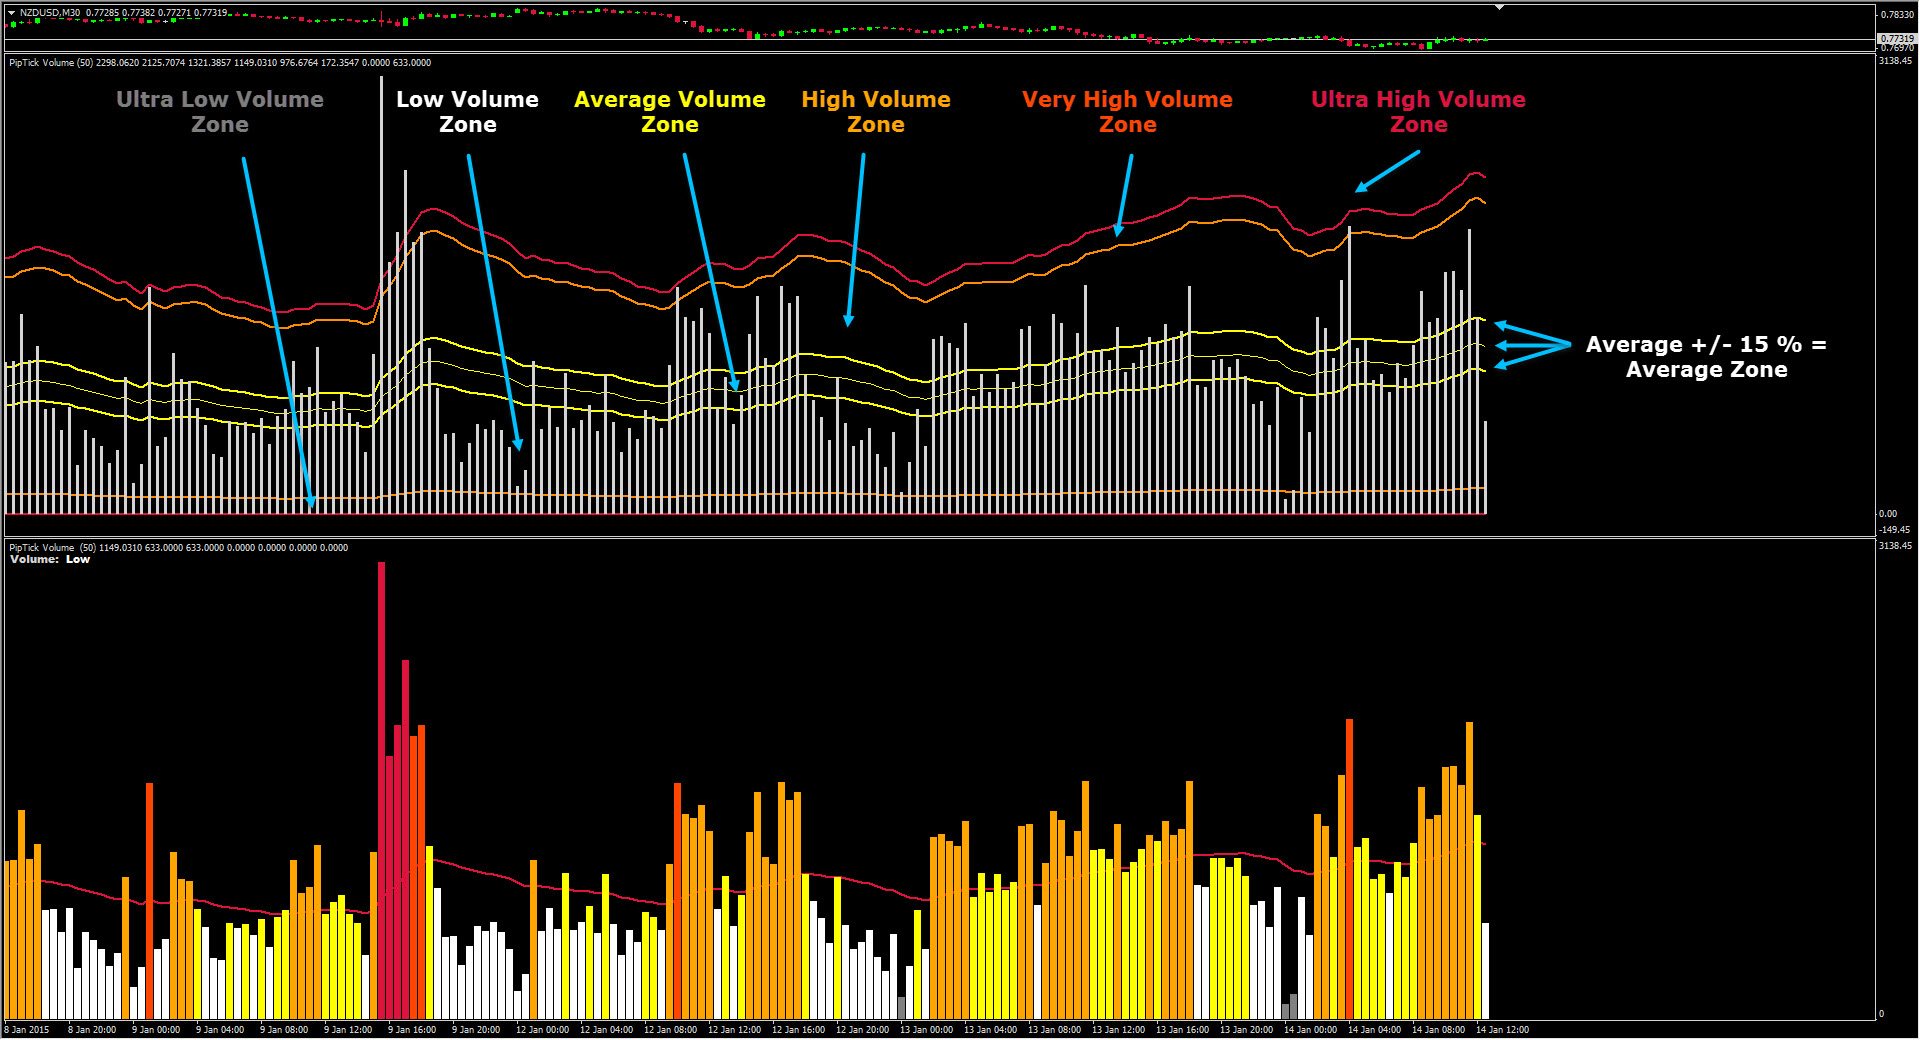
Accordingly, the area where the volume is located (relative to the moving average) is labeled as ultra-low, low, average, high, very high, or ultra-high.
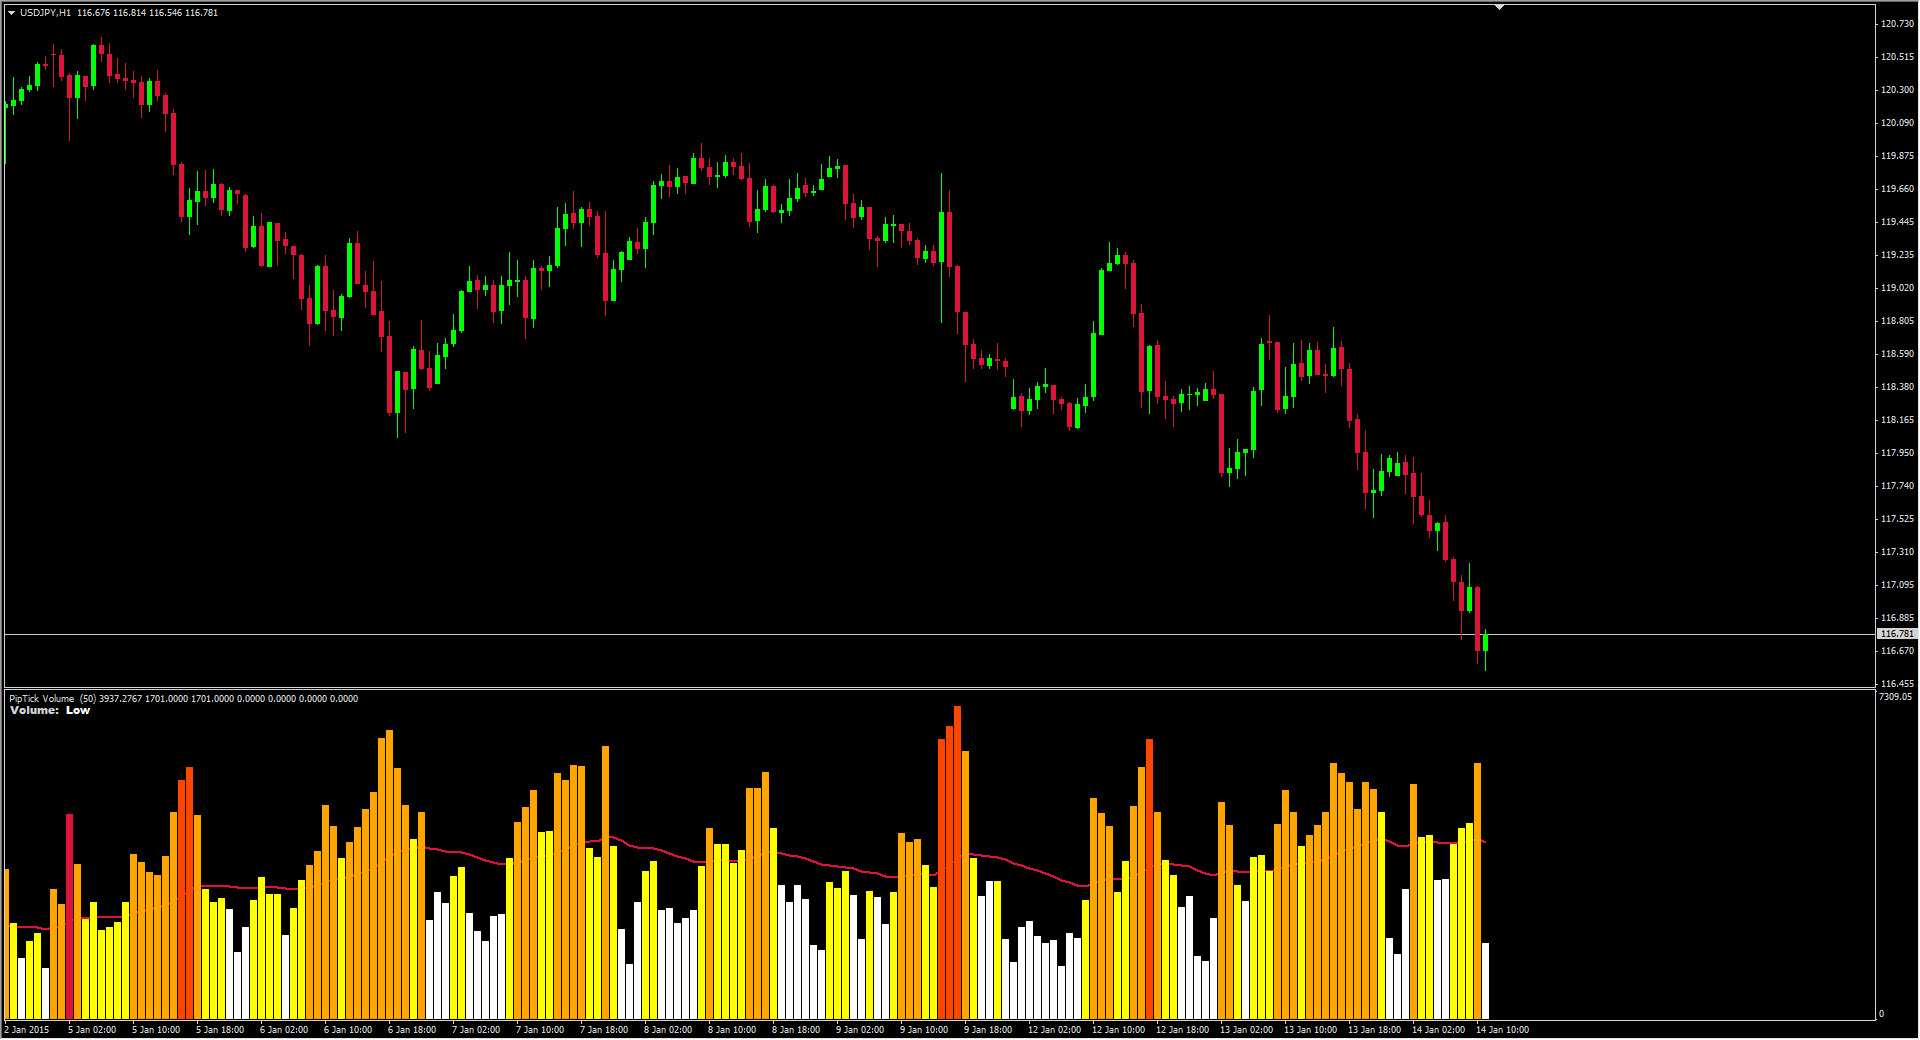
By default, there are six zones that a user can change. Depending on which zone corresponds to the volume, the histogram bar is colored with an appropriate color. This way, you can easily recognize how high the volume is compared to previous bars.


All our products are available in the MQL5 market.