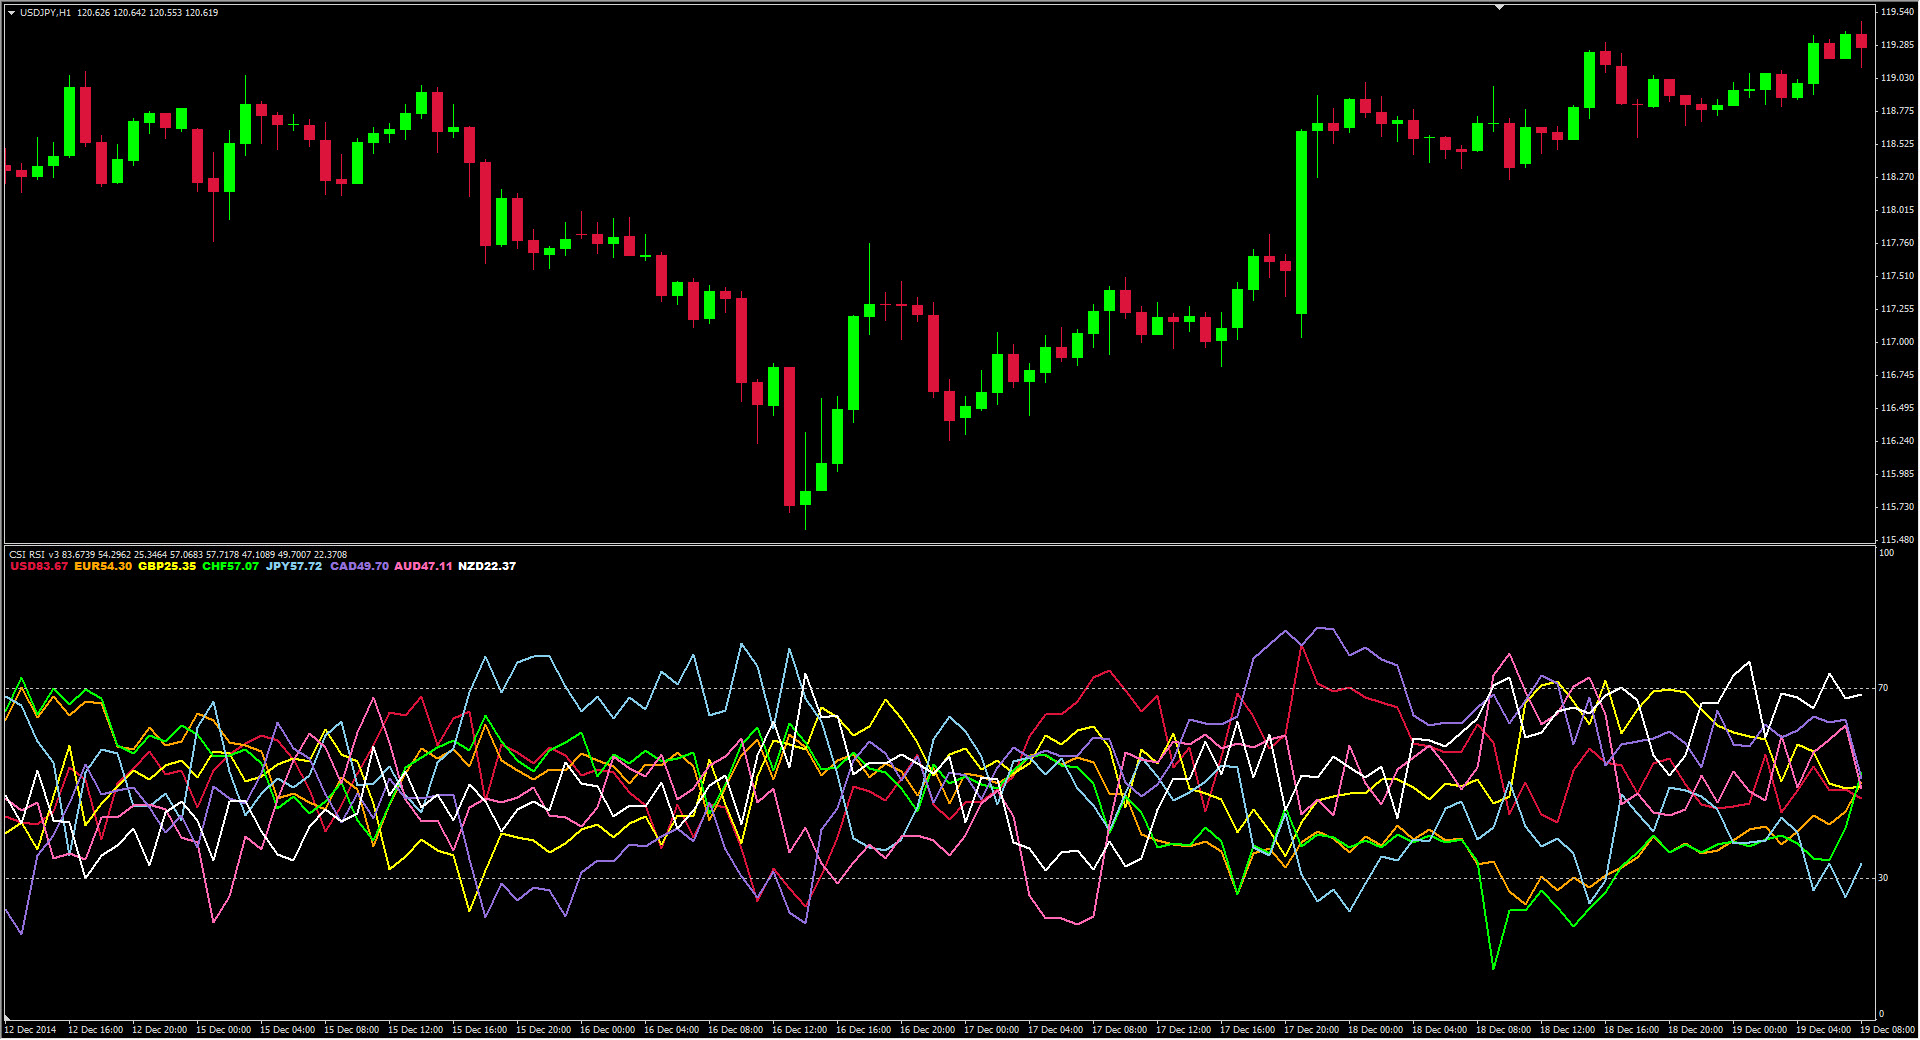
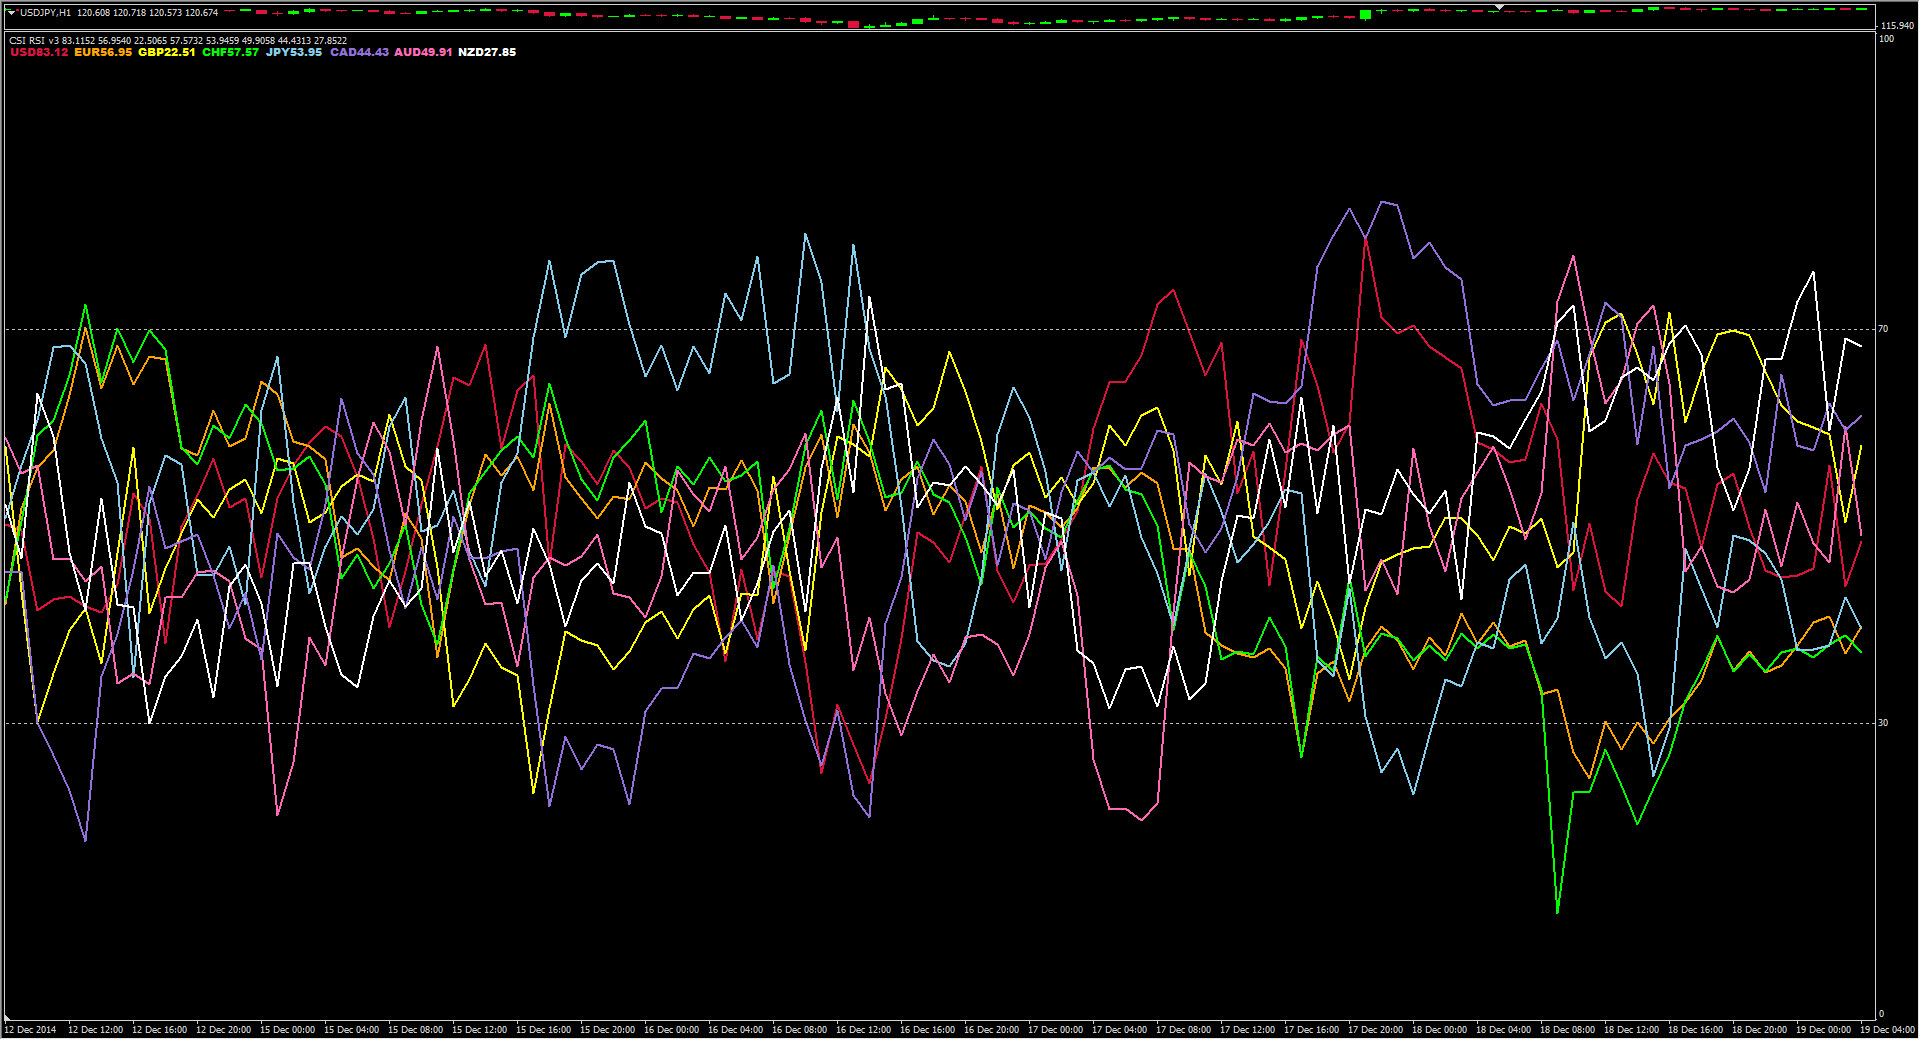
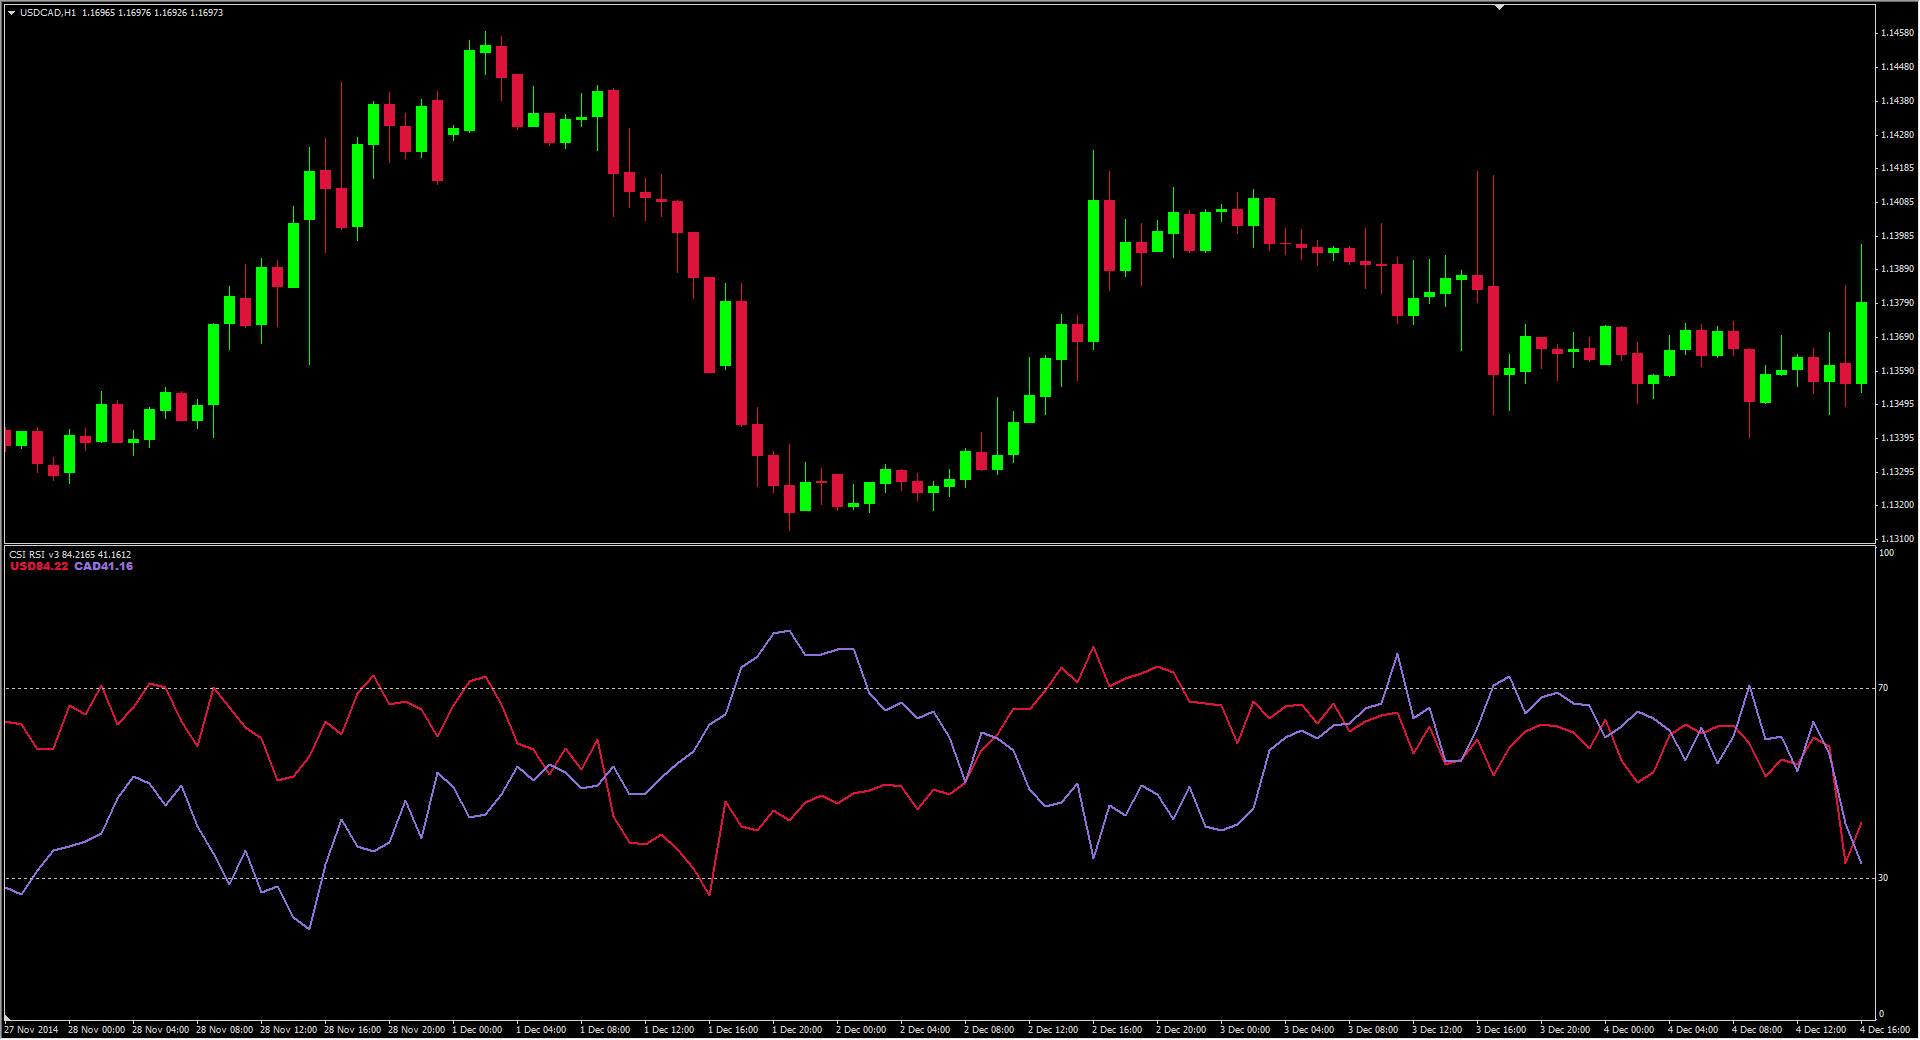
Knowledge of the strength and weakness of each currency is vital for every forex trader. Our Currency Strength Meter indicator measures the strength of eight major currencies (USD, EUR, GBP, CHF, JPY, CAD, AUD, NZD) by using the Relative Strength Index indicator, also known as RSI. The Currency Strength Meter indicator shows you, simply and quickly, when a currency is oversold, overbought, or in “normal area”. This way, you can identify which currency is the strongest and the weakest.
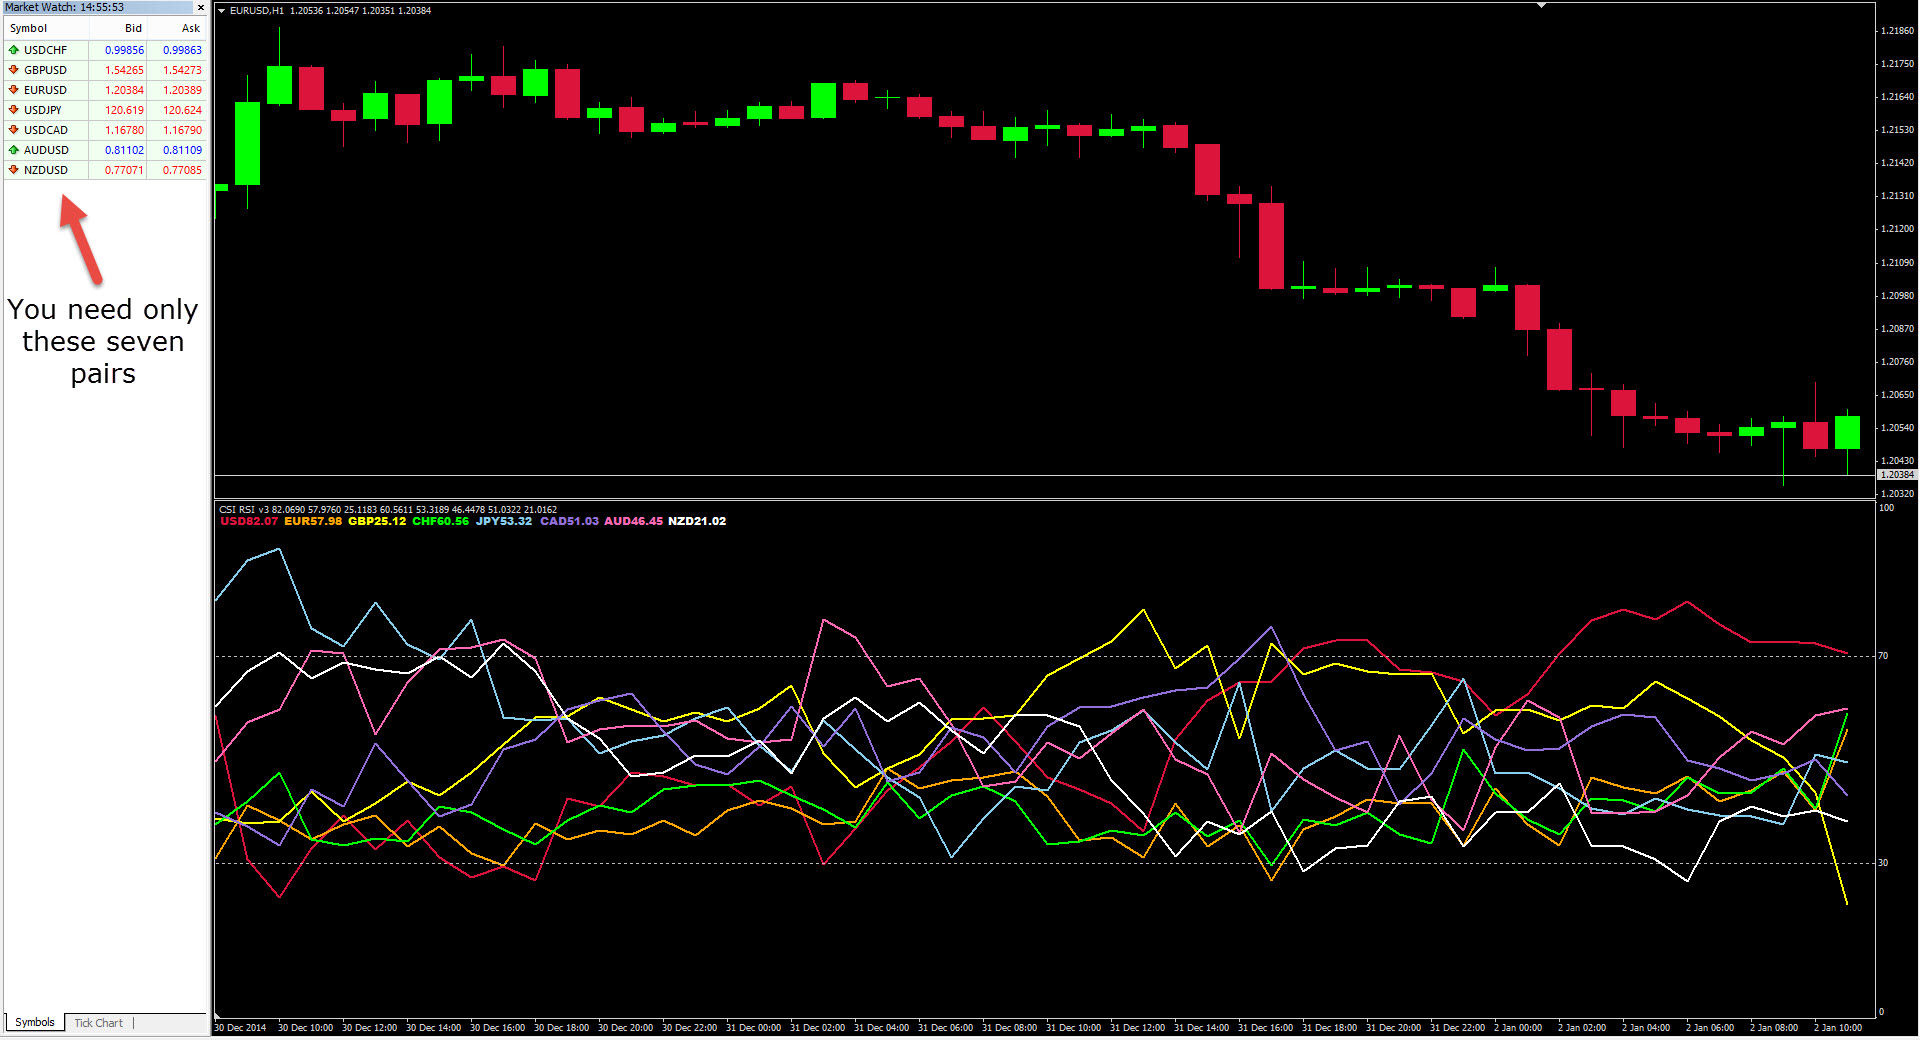
Our indicator is calculated from 28 currency pairs and works on every MT platform. The CSM indicator uses only seven currency pairs to calculate the rest of the 21 pairs. Therefore, for the correct working of the indicator, you need only these seven pairs in your MT platform: EURUSD, GBPUSD, AUDUSD, NZDUSD, USDJPY, USDCHF, and USDCAD.
Our indicator is calculated from 28 currency pairs and works on every MT platform. The Currency Strength Meter indicator uses only seven currency pairs to calculate the rest of the 21 pairs.
Therefore, for the correct working of the indicator, you need only these seven pairs in your MT platform: EURUSD, GBPUSD, AUDUSD, NZDUSD, USDJPY, USDCHF, and USDCAD.
Note: If the indicator is used in Strategy Tester, all pairs’ data must be downloaded in History Center before (How-to). No downloads are needed if it is added to the chart as usual.
Because our CSM indicator is based on well-known indicators, its interpretation is straightforward.
There are two basic approaches to how to trade currency strength and weakness.
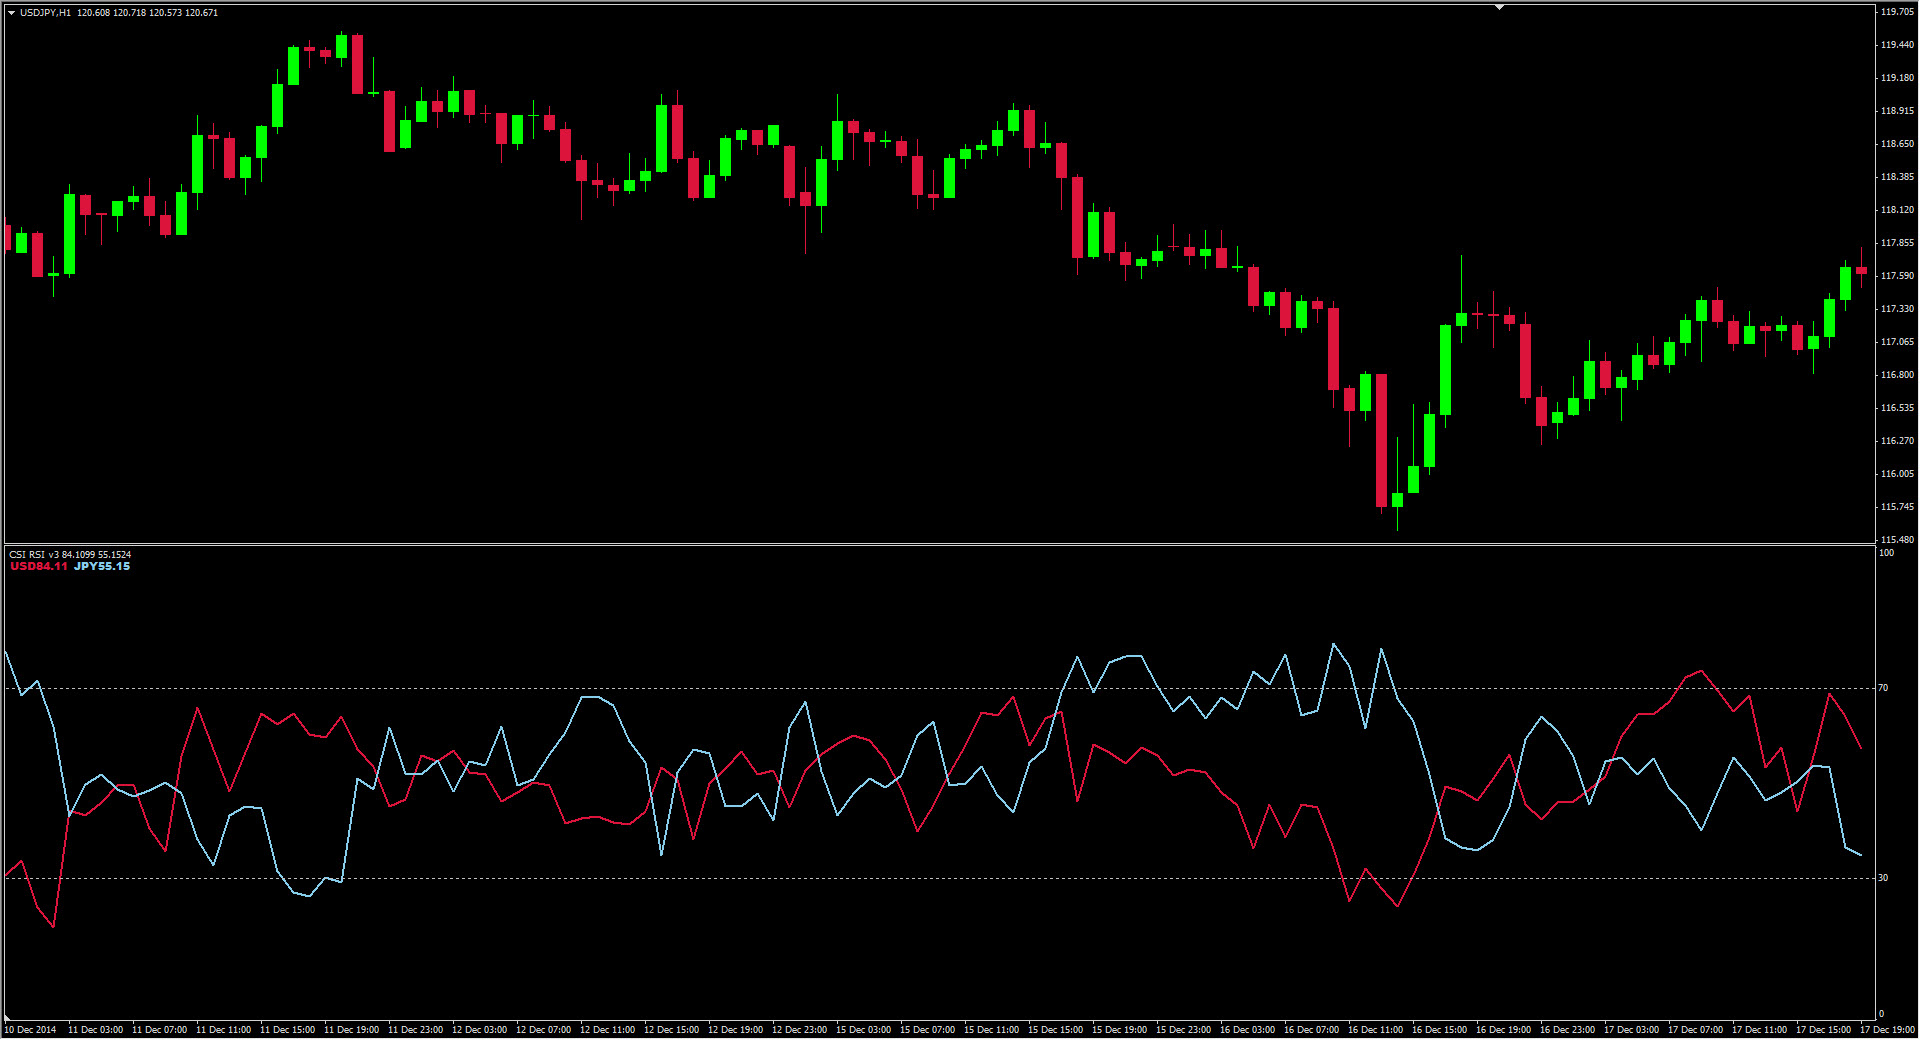
You can achieve great results if you use the overbought/oversold concept of currency in conjunction with Price Action or Candlestick patterns. All you have to do is wait for the overbought/oversold of one currency, followed by drawing a candlestick pattern like a hammer or shooting star. Of course, this is just one of the thousands of possible ways to use our currency strength indicator.
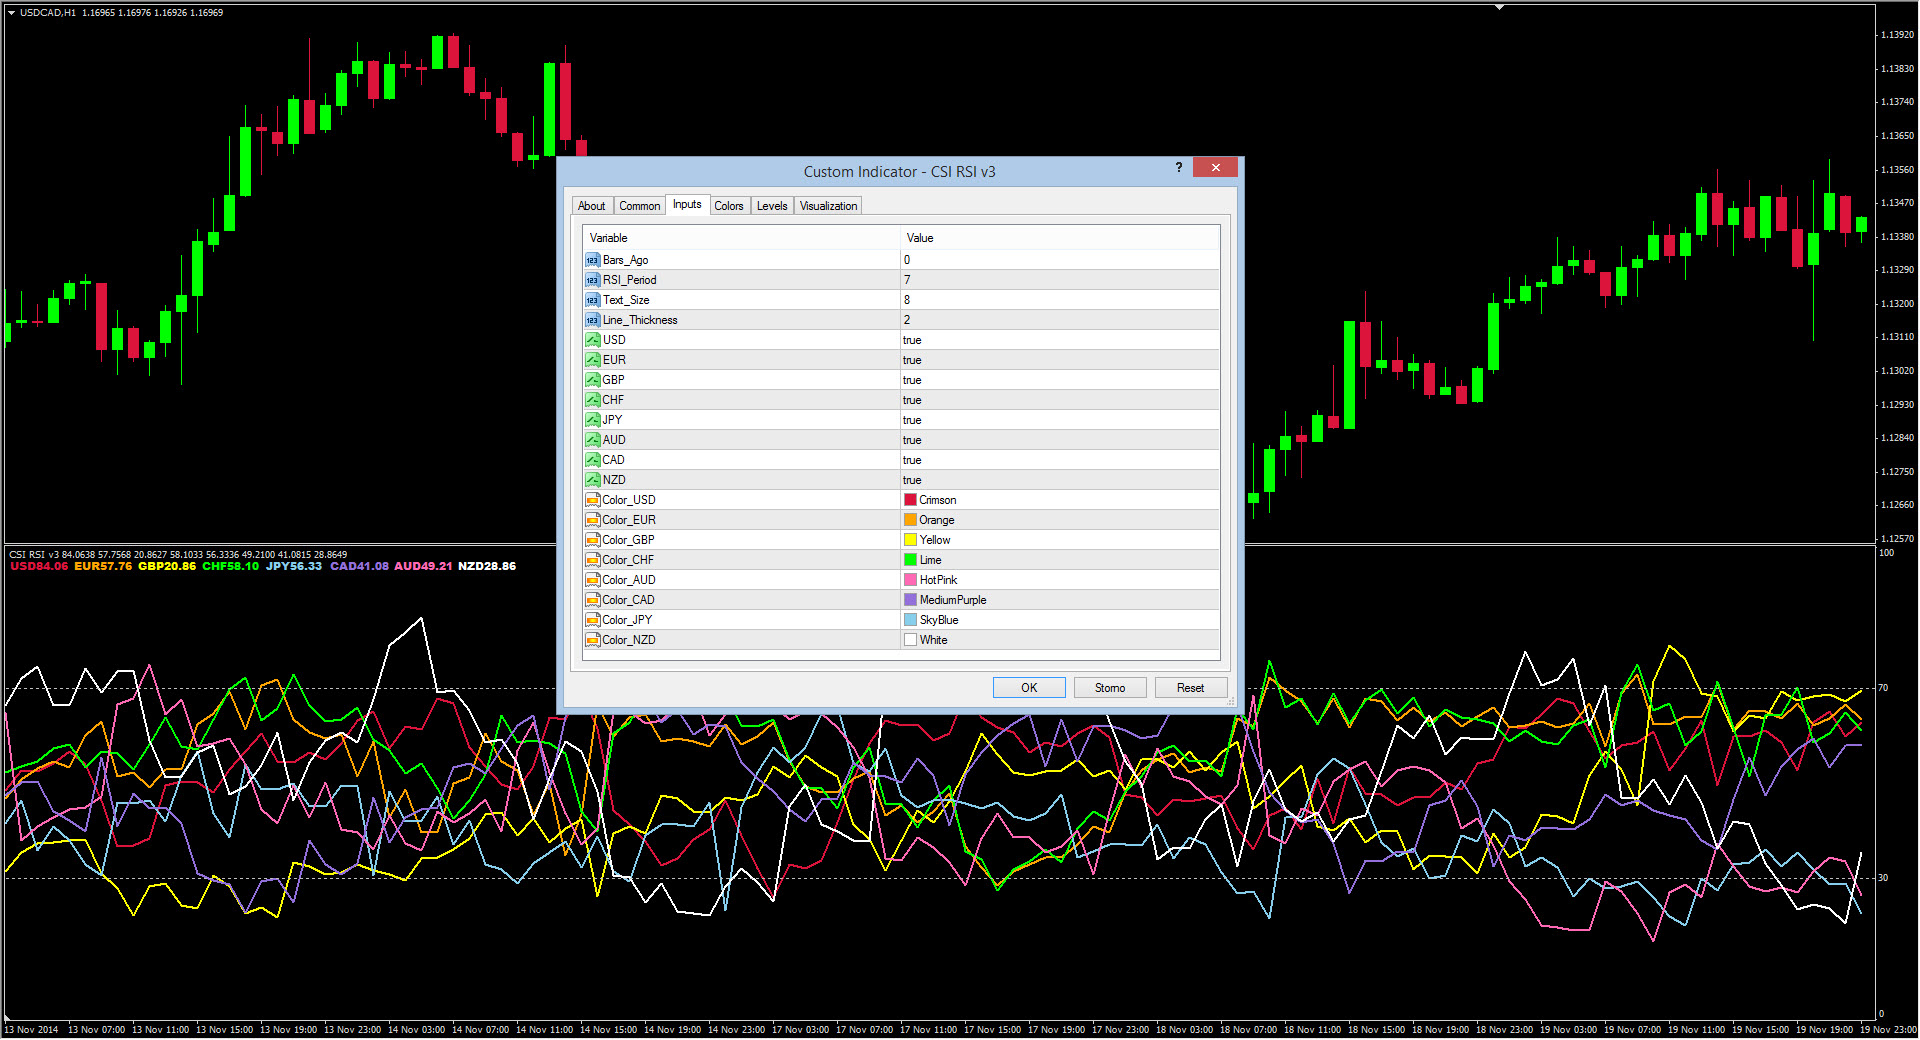
It is possible to use the CSM indicator for manual backtest as well. All you have to do is set parameter “Bars_Ago = 0” in indicator settings and download historical data for seven currency pairs which our indicator needs to calculate.

All our products are available in the MQL5 market.